I've Got My Eye on....
morning musings 7.28.26- views from the waterlogged island



"Only when the tide goes out do you discover who's been swimming naked." ~Warren Buffett.
The hawkish hold case is everywhere this morning, and it rests on one number: US inflation running at 4.2 percent.It is not. It has not been since May.
June CPI landed on 14 July. Headline 3.5 percent. Core 2.6 percent. The month over month print was minus 0.4 percent, the largest one month decline since April 2020 (BLS). Consensus was looking for minus 0.2 and 3.8. It was a miss across the board and it was on every front page.
And this morning, on 28 July, that dead number is still doing the work. The hike the front end half believes in and the hawkish hold the rest of the market is bracing for both lean on it. The Fed is being asked to fight a print that no longer exists, and the pricing that says otherwise has not looked at the print.
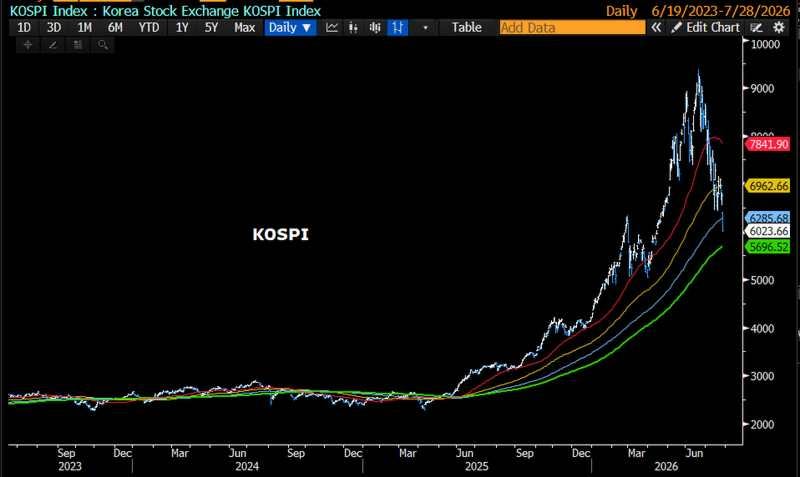
State of Play: the Kospi fell almost 11 percent overnight. SK Hynix and Samsung each shed north of 13. Trading halts on the Korea Exchange, MSCI Asia Pacific into correction, a Chinese DUV lithography headline, and a $250bn Nvidia backstop story doing the rounds (WSJ). Great copy. Genuinely dramatic. Not the story.
TL;DR
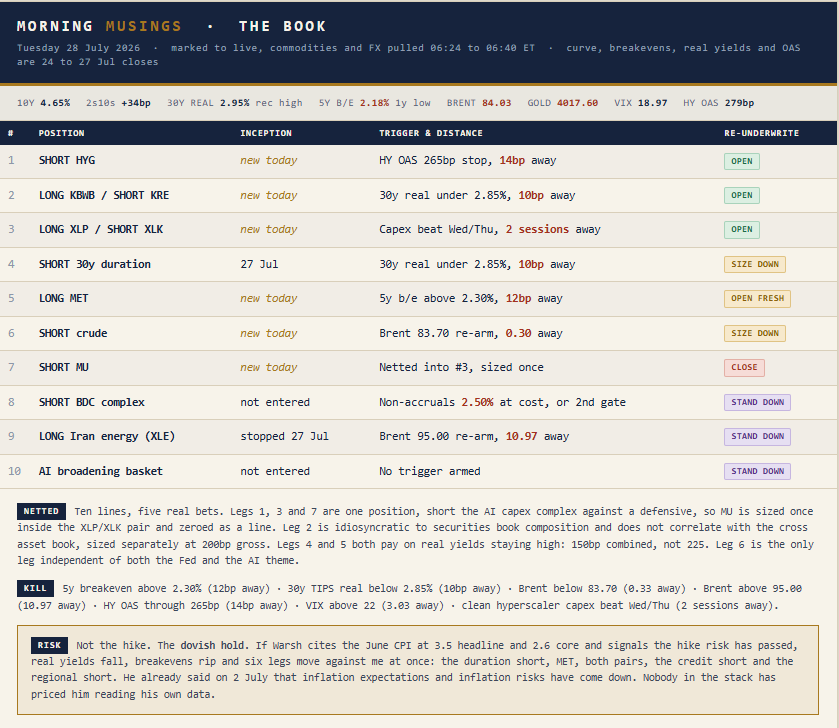
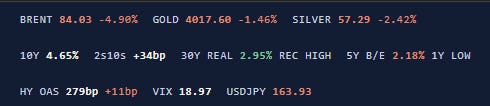
This is a real rate shock, not an AI story. The 30 year TIPS real yield closed at 2.95 percent on 24 July, the highest reading in the history of the series, which begins 22 February 2010 (FRED). Sixteen and a half years of data. Thirty-year money has never cost more in real terms.
The 5 year inflation breakeven closed at 2.18 percent on Monday. That is a one-year low, and it is down 12bp from 2.30 on Wednesday (FRED). Exactly one session in the last 250 sits at or below it: Monday’s.
Everything being liquidated this morning was the same bet: long duration, long the debasement, long the energy shock, short the dollar. Chips were the last leg of that trade, not a separate one.
Credit turned. HY OAS 279bp on 24 July, plus 11bp in two sessions off 268. IG 80bp, plus 4bp in a fortnight (FRED). Small. But the sign flipped, and it flipped first.
The market prices roughly 38 to 40 percent odds of a hike tomorrow. I am fading that.
I am wrong if the 5 year breakeven takes back 2.30 percent while the 30 year real yield drops under 2.85. Both, together. That is the print that kills this.
MY READ
There is one trade coming off this week and it is not artificial intelligence.
For two years the market was a single position wearing four costumes. Long duration equity. Long gold. Long the energy shock. Short the dollar. Every one of those was the same wager: that the real discount rate would stay capped and the debasement would continue. You could express it in Nvidia or in bullion and you were making the identical bet.
That bet is being unwound. And it is being unwound from the inflation side, not the growth side.
Look at what is actually down this morning. Gold. Silver. Crude. Breakevens. Momentum. Chips. Now look at what is up. The dollar, within a whisker of a twelve month high against the euro. Real yields, at a record. Then tell me with a straight face that this is a story about immersion lithography in Shanghai.
Here is the mechanic nobody wrote up:
Between 17 and 24 July, the 10-year real yield went from 2.31 to 2.43 percent, a 12bp rise, while the nominal 10-year went from roughly 4.55 to 4.69 (FRED). Then last week’s headlines said bonds rallied because the nominal eased 4bp into Monday’s 4.65.
Bonds did not rally. The inflation compensation inside the bond collapsed and the real yield stayed pinned at the high. If you own a long duration asset, the number that discounts your cash flows went up last week. The tape reported the opposite.
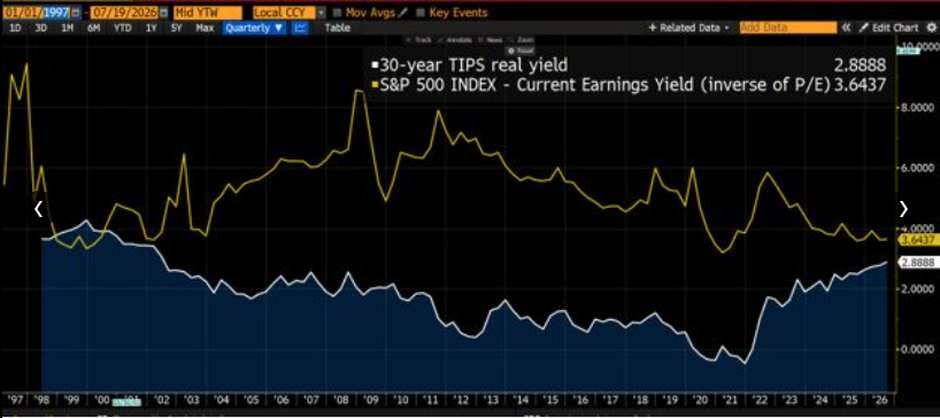
Perspective: this is why the AI de-rating and the gold collapse are the same event. A hyperscaler capex program and a bar of bullion are both zero coupon claims on a distant future. Raise the real rate at which that future is discounted and both marks fall, in the same week, for the same reason, and the financial press writes two unrelated stories about it.
The 2026 vintage of that mistake is calling this a chip story. It is a discount rate story with a chip story sitting on top of it.
The strongest argument against me is the consensus read of this tape, and it deserves stating in full because it is not lazy. It says the macro is benign, oil and yields are both down and both disinflationary, and the equity move is idiosyncratic to the AI complex, a financing story rather than a rate story.
The proof it offers is the decoupling: the Dow is green while the Nasdaq bleeds, so this cannot be a macro repricing. I think that reads the sign backward. A duration repricing produces exactly this dispersion. Raise the real rate and the shortest-duration cash flows- the Dow’s value and cyclical names- beat the longest, which are the Nasdaq’s. The green Dow is not evidence against a rate shock. It is the fingerprint of one.
Where the consensus is right, and where I was too quick, is that the AI financing crack is real and partly its own animal. But it is not a rival cause. It is the transmission. The real rate is why the financing crack is happening now, and the financing crack is how the real rate reaches the one equity that refuses to mark to it.
Buffett’s famous line about the tide is appropriate this morning, and this time it has a specific mechanism. The water is the real cost of capital. When it sat at zero, every buildout could self-finance and you could not tell the swimmers from the borrowers. It is going out now, and the first one caught without a suit is the largest AI project on the board, holding a guarantee from its own chip vendor. That is what going around and around gets you: a circle that looks like growth until the tide drops and you can see it is a circle.
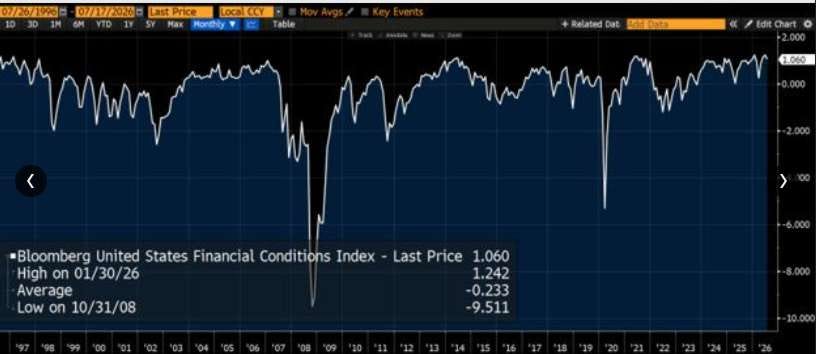
And who owned it? Everyone. US households hold roughly 27 percent of their assets in equities, at or through the 2000 peak (Fed / ECB, via MacroTourist). Retail call buying in the hyperscalers just printed a six-year high (Cboe). Goldman has 30-day momentum vol at 100.69 against the S&P at 13.83 and its own AI basket at 12.15 (GS, 21 Jul). Momentum is realizing seven times index vol. That is not a market with dry powder. That is a market where the marginal buyer already bought, on margin, in calls.
WHAT MATTERS TODAY
FOMC. The meeting starts today. The decision is tomorrow, Wednesday 29 July at 2:00pm ET, presser at 2:30, Warsh chairing, no SEP (CME / Morningstar). One of the documents on my desk this morning says 30 July. It is the 29th. Fed funds sit at 3.50 to 3.75, unchanged since 10 December 2025.
The odds, and the derivative of the odds. Hike probability was 10.7 percent on 15 July. It was 34.7 percent on the 22nd. It printed around 38 by the 24th, and Goldman had market pricing at roughly 40 on Sunday (CME FedWatch / GS). It quadrupled in nine days on an oil spike that has since round tripped. The level is not the interesting part. The velocity is, and so is the fact that it repriced on energy while the energy went away.
Crude. Brent 84.03, down 4.90 percent, opened 87.99, session low 82.87. The 50 day is 83.97 and the 200 day is 83.73. It is trading inside 30 cents of both. Below there the chart has nothing until the pre war range. Every brief in my stack this morning printed Brent between 85.25 and 87.55. All of them were too high, and all of them were snapshots from before the tape moved.
Korea. Kospi 6,023.66, through three of its four moving averages in a single session, with only the slow line at 5,696.52 left underneath.
MOVERS THAT MATTER
The memory complex. SK Hynix down about 15 and Samsung about 13, roughly $600bn of market cap gone from Hynix in just over a month, ADR premium compressed under 20 percent (BBG). So what: the proximate catalysts were a Chinese DUV report and circular financing worry. Both are real. Neither explains why gold, silver and crude are down in the same session. When the alleged cause of a selloff cannot account for two thirds of what is selling, the cause is upstream of both.
Oracle’s credit. ORCL five year CDS at 210.675, having printed a two year high of 215.610 on 24 July. Two years ago it traded in the thirties.
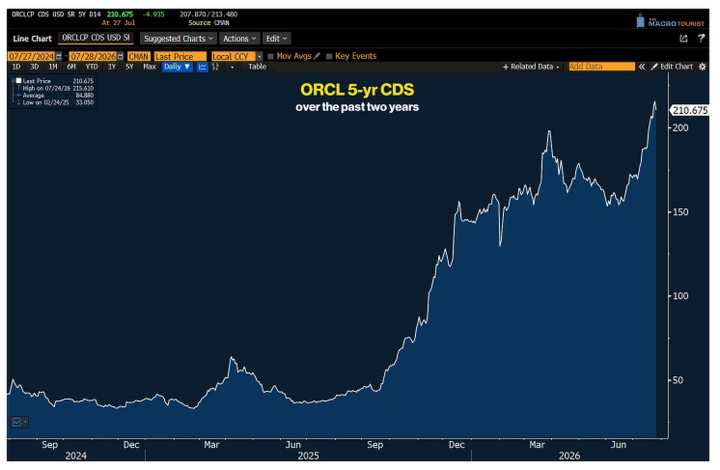
Microsoft’s five-year printed 51.505 against a two-year average of 26.308, and Meta’s printed a fresh two-year high of 93.585 yesterday, against an average of 65.465 (CMAN, via MacroTourist).
So what: the strongest balance sheets in corporate America are being repriced in the credit market while their equities are treated as the safe haven inside the index. Somebody is wrong. It is not usually the CDS desk.
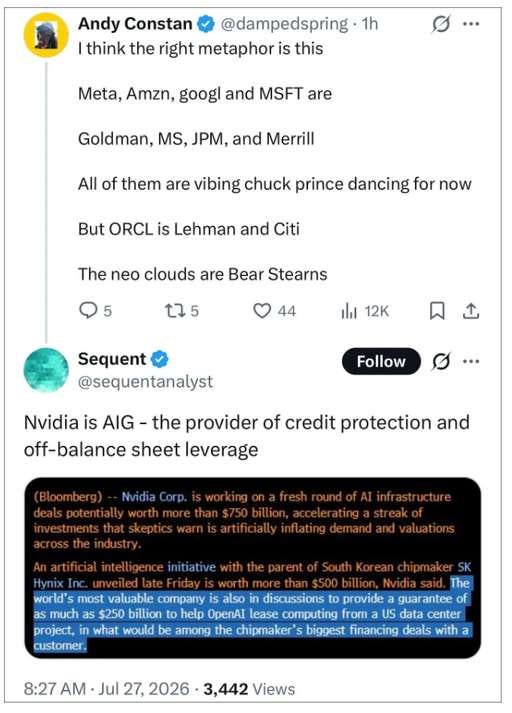
The framing is sharp and worth making concrete, because the deal that forked the tape overnight is precisely this structure. Nvidia is in talks to guarantee roughly $250bn of OpenAI’s data center debt for a 10 gigawatt campus in southern Ohio that runs past $500bn all in, developed by SoftBank’s energy arm, with a separate $350bn of chip purchase financing discussed alongside it (WSJ).
The reason the guarantee has to exist is the whole story: OpenAI cannot reach investment grade on its own credit, so its chip vendor stands behind the paper. Michael Burry, short the name into it, called it ‘around and around we go’ (via X).
The number that should stop you is in Nvidia’s own filing. Its Q1 fiscal 2027 10-Q caps total lease guarantee exposure at $3.5bn. A $250bn commitment is roughly seventy one times the guarantee book it currently discloses (Nvidia 10-Q, via Benzinga).
Here is where it joins the thesis rather than sitting beside it. Everyone is calling this a bubble tell, and it is, but it is a bubble tell with a rate cause. A buildout that pencils at a zero real cost of capital does not pencil at a record one. Raise the real discount rate to an all-time high, and the marginal AI project stops self-funding, which is the exact moment the vendor has to guarantee the paper. So, Nvidia backstopping OpenAI is not a separate event from the gold collapse and the duration selloff. It is what a real rate shock looks like when it reaches the longest duration, most speculative cash flows in the economy. And note who else the deal is reported to help: Oracle, whose five-year CDS is already at a two-year high. The credit market was pricing this before the equity market found a name for it.
The Nasdaq’s own chart. NDX closed at 28,039.21, below its 50 day at 29,493 and above its 200 day at 26,448. RSI(21) at 42.91, MACD at minus 298 against a signal of minus 147.
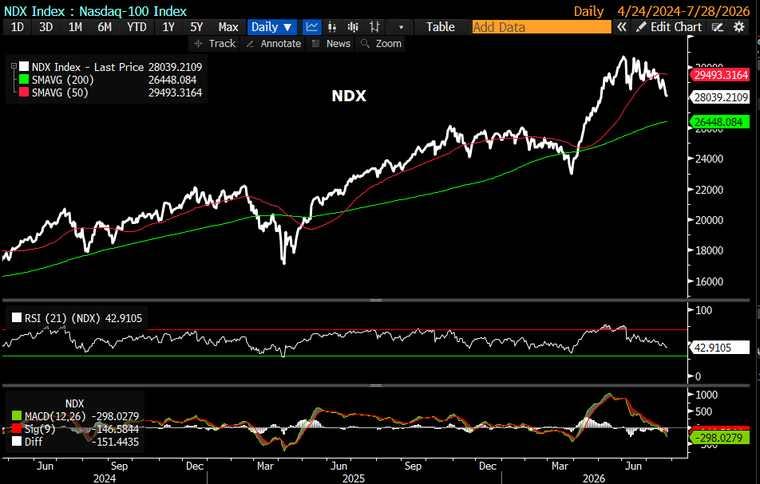
So what: the S&P closed Monday at 7,413.18, below its own 50 day at 7,471 (FMP). The Dow closed at 52,210.08, above its 50 day at 51,498. The Russell closed at 2,948.04, above its 50 day at 2,932 and only 3.2 percent off its year high (FMP). Two of the four major US indices are still in uptrends. The two that are not are the two that carry the AI weight. The broadening everyone has been waiting for arrived, and it arrived the ugly way, by the top falling rather than the bottom rising.
FINANCIALS
Start with the frame, because it is the right frame and it is worth reading before I take it apart.
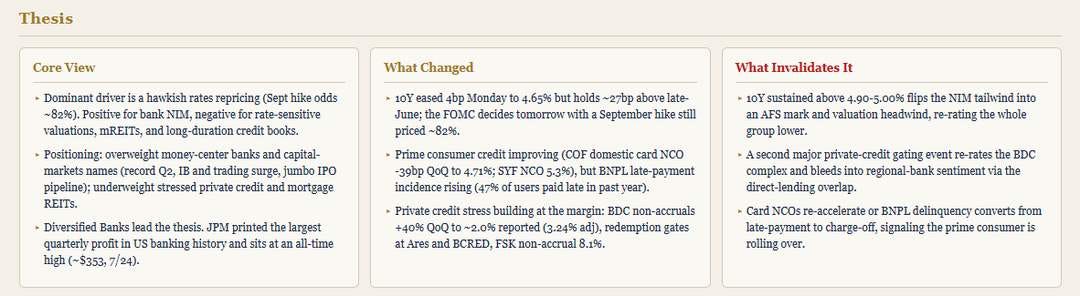
Where I part from the standard read: the invalidation everyone keys to, the panel above included, is the nominal 10 year sustained above 4.90 to 5.00 percent. That is the number the whole street watches for AFS marks, and it is the wrong number this cycle. A securities book does not care about the nominal yield. It cares about the discount rate applied to a fixed nominal cash flow, and in a portfolio built between 2020 and 2022 the relevant comparison is against the real rate at which those bonds were bought. The 30-year real yield is already at an all-time high at 2.95 percent, with the nominal 10-year sitting at 4.65 percent (FRED). The regional cohort does not need 4.90 to have a mark problem. The mark is already there. It is simply not being reported that way, because everybody is watching the nominal.
That is the whole edge in this sector today, and it splits the group cleanly.
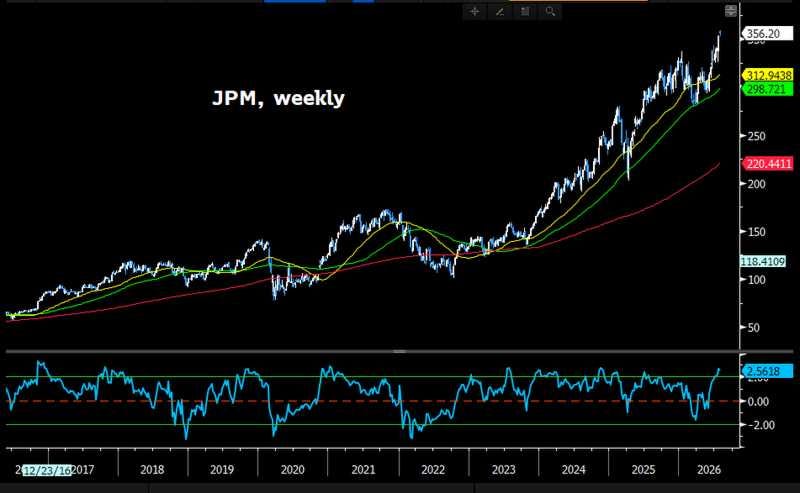
Money centers. The earnings are not in dispute. JPM printed the largest quarterly profit in the history of US banking at $21.2bn, EPS $6.14 against $5.85 consensus. GS printed diluted EPS of $20.98, roughly double year-on-year, on $20.34bn of net revenue, up 39 percent, with SpaceX IPO fees inside it (2Q earnings). Diversified funding, fee engines running, capital return resuming post-stress test. Real yields at a record are a NIM tailwind for this cohort, not a headwind.
Regionals. The opposite side of the same coin. KRE is near all-time highs on solid Q2 prints, deposit betas easing, and roughly $1tn of CRE maturing in 2026 against refi rates near 6.24 percent versus a 4.76 percent maturing coupon (market data). Held securities books built in a zero real rate world, now marked against a record real rate. Momentum has been improving, and the gap to the money centers has been closing, which is precisely why the risk-reward has flipped.
And here is the contradiction I had to resolve. The standard financials read wants it both ways: short KRE against the money centers on the CRE overhang, and, elsewhere, own KRE as the under-owned contrarian long if CRE stabilizes. Those cannot both be the trade. Under today’s setup the short wins, but not for the CRE reason. It wins on the securities mark, which is a real rate function and does not need CRE to cooperate. The thesis gets restated or the trade gets cut. I restated it.
Insurance. Life is the cleanest beneficiary of a record real yield, because reinvestment income is a real phenomenon and spread businesses roll old assets into new coupons. The caveat the sell side keeps burying is the alternatives book. Life balance sheets have been stuffed with private credit for four years, and private credit is the subsector where the stress is actually visible. P&C is a separate animal, and it is wobbling: CINF missed at $1.43 against $1.82 with a combined ratio 300bp worse than expected at 100.8 percent, blamed on catastrophe losses, which sits awkwardly next to strong prints from TRV and CB (2Q earnings). When one insurer’s cat losses are three times the sector’s, that is not weather. That is reserving.
BDCs and private credit. The tell of the cycle. Aggregate BDC non-accruals up 40 percent quarter on quarter to roughly 2.01 percent at cost, about 3.24 percent adjusted. FSK at 8.1 percent non-accrual with a 40 percent dividend cut from peak. Ares Strategic Income capped redemptions at 5 percent against requests of 11.6. BCRED lifted its cap to 7.9. Non-traded BDCs saw their first-ever net outflow in Q1 (BDC filings). Every one of those loans was underwritten against a real cost of capital nowhere near 2.95 percent.
And now the two stories converge. The reason the AI financing crack is a financials problem and not only a technology problem is that the paper has to sit somewhere. The banks and private credit funds warehousing vendor-guaranteed, subinvestment-grade data center debt are the same balance sheets already printing the BDC nonaccruals above. Stressed direct lending books and half-trillion-dollar AI infrastructure paper are not two risks. They are one book, and it is the book I am shorting through the BDC complex and watching through the regional leg. If AI financing spreads widen on the megacap guides, private credit is where it lands first, and the regionals with the deepest direct lending overlap are where it lands second.
Consumer finance. Genuinely improving and nobody wants to hear it. COF domestic card NCO at 4.71 percent, down 39bp on the quarter and 54bp on the year, delinquency 3.39 percent and falling. SYF at 5.3 percent against 6.38 a year ago (2Q earnings). The offsetting worry is BNPL, where 47 percent of users report a late payment in the past year against 41 in 2025 and 34 in 2024, and AFRM sits at 2.8 percent on 30 plus days. That has historically led bank NCOs by four to six weeks and it has not shown up yet.
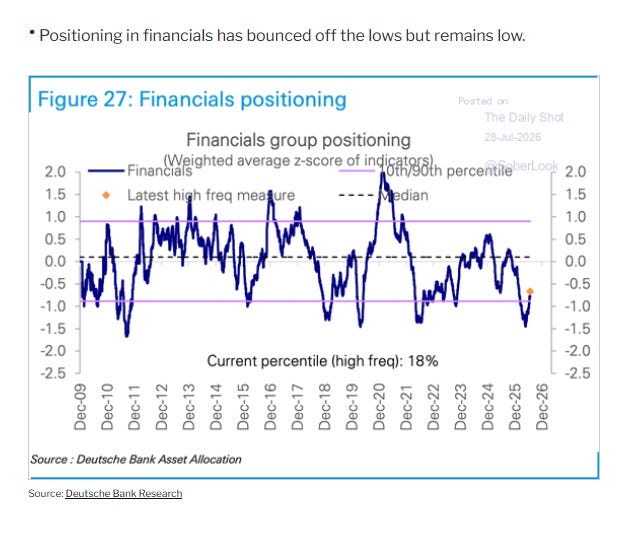
The positioning read, which is the whole point. Deutsche has the financials group at the 18th percentile of its own positioning history.
So what: a sector at the 18th percentile of positioning, printing the largest bank quarter in American history, with its flagship at a fresh high, in a regime where the dominant macro variable is a NIM tailwind. That is not a crowded long. That is an under-owned leader, and the dispersion inside it is wider than at any point since the regional crisis. Nobody is paid for owning XLF here. You are paid for owning the right half of it and shorting the other half. Both financial expressions behind the wall are intra-sector for exactly that reason.
SECTORS
XLK. The longest duration cash flows in the index meeting the highest real discount rate on record. This is the sector the trade is happening to, not the sector causing it.
XLC. META reports Wednesday after the close with the capex line, and its five year CDS printed a two year high yesterday. The equity holders and the bondholders are not reading the same company.
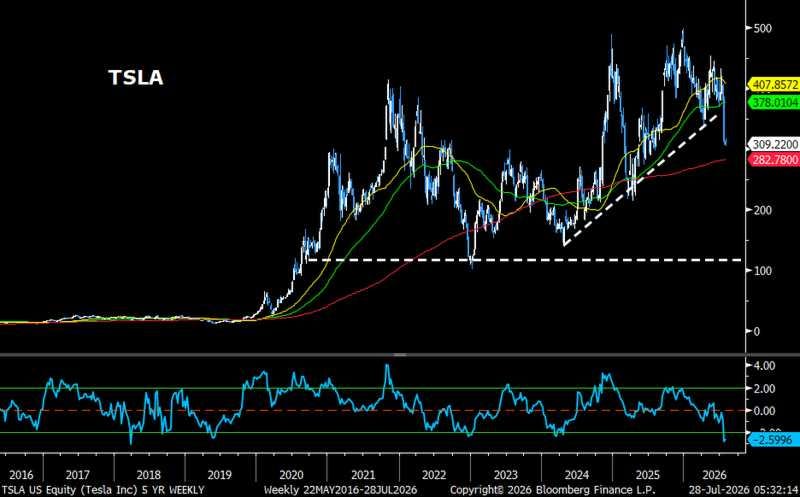
XLY. TSLA broke a four year trendline on the weekly. Structurally broken, tactically stretched, and those want different time horizons.
XLP. Unilever’s Q2 was plus 5.8 organic with volume at 5.5 and pricing at 0.2, the strongest quarterly volume in sixteen years (Unilever). Read that mix again. Volume driven, not price driven. That is what staples look like when disinflation is real, and it is why this is the defensive I want rather than utilities.
XLE. Brent pinned to the 50 and 200 day. Integrated buyback math gets uncomfortable in the seventies, and the strip is heading there if 83.70 goes.
XLF. See above. The one sector where price and positioning disagree, and price is winning.
XLV. UBS upgraded SYK, MDT and BDX on the same morning. Three stock calls published simultaneously is a sector call wearing a disguise, and the defensive bid it is chasing is a flow rather than a thesis.
XLI. Safran raised on LEAP demand, Nucor beat and guided higher, Boeing has a 737 seat inspection headline. The unexamined leg is PWR and ACM, whose backlogs are data center build pipelines that have not de-rated with the thing they are building.
XLU. The data center power trade is a geared bet on hyperscaler capex carrying a bond’s duration. It is the single worst thing to own in a real rate shock and it is the one nobody has sold yet.
XLB. Nucor’s steel mill pricing carried the quarter and lower crude helps the input line. Dull, and dull is fine this week.
XLRE. Cap rates key off the real yield, not the nominal. The 30 year real at an all time high is a REIT problem before it is a technology problem, and REITs have not marked it. Data center REITs get it from both ends.
FLOWS & POSITIONING
Goldman’s work on momentum around large rallies is the most uncomfortable chart in the stack and it deserves to be.
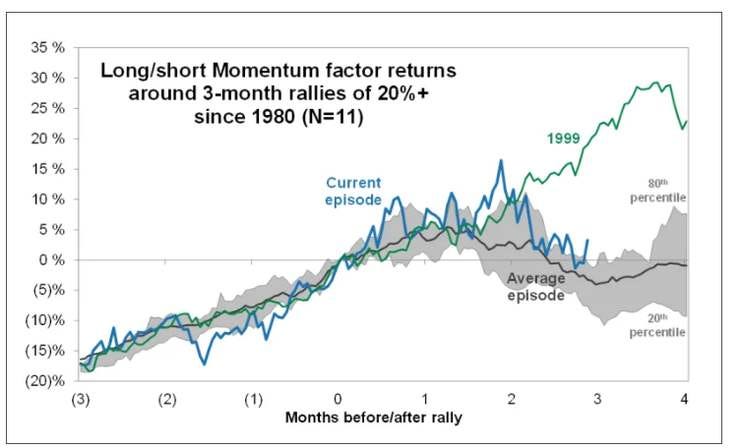
Two readings and they are opposites. Either the current episode is 1999 and there is a further leg up that punishes anyone short momentum, or the analog broke last week and the average episode path, which mean reverts hard through month three, is the one you are on. The chart cannot tell you which. What it can tell you is that the payoff is asymmetric in both directions and that sizing, not direction, is the decision.
What supports the second reading is that momentum’s realized volatility has gone vertical. Goldman’s momentum factor is at 100.69 on 30 day vol against the S&P at 13.83 and the AI basket at 12.15 (GS / BBG, 21 Jul). A factor realizing seven times index volatility is a factor being liquidated, not a factor working.
And the household number underneath it: roughly 27 percent of US household assets in equities as of 31 March, at or through the 2000 peak, against about 16 percent in the eurozone (Fed / ECB, via MacroTourist). Households are maximally long, expressing it in calls on the four largest companies in the index, at the moment the discount rate on those companies printed a sixteen year high.
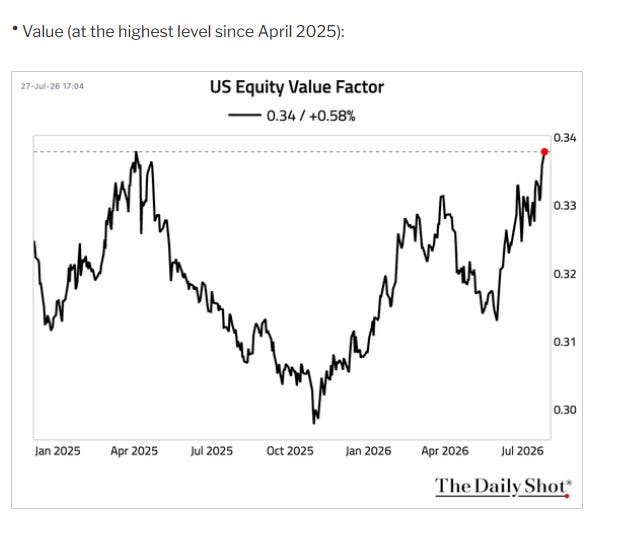
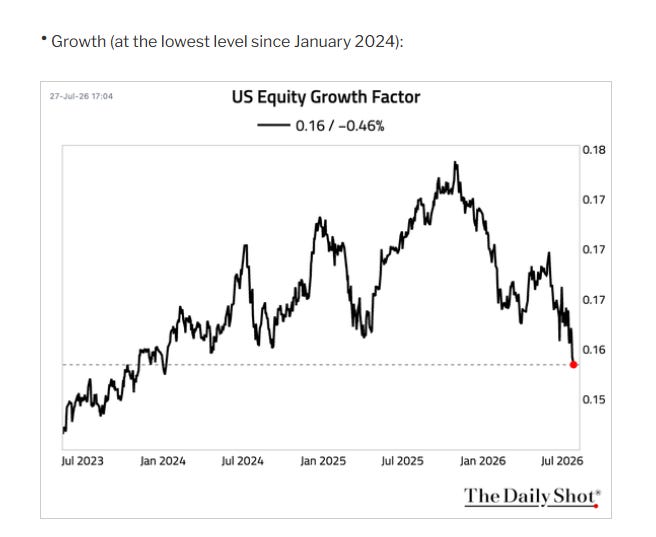
Tangentially, on the factor tape: the US equity value factor is at its highest since April 2025 and the growth factor at its lowest since January 2024 (The Daily Shot, 27 Jul). Value over growth is not a style preference. It is a duration preference, and it is the same trade as everything else in this note.
One more, because it is the tell that this is a liquidation and not a view. Goldman’s cross-sectional work has financials at roughly minus 0.58 year-to-date correlation with the AI basket pair, the most negative of any sector (GS / FactSet). In a genuine growth scare financials go down with everything. They are not. The money is not leaving. It is moving, and it is moving out of the longest duration into the shortest.
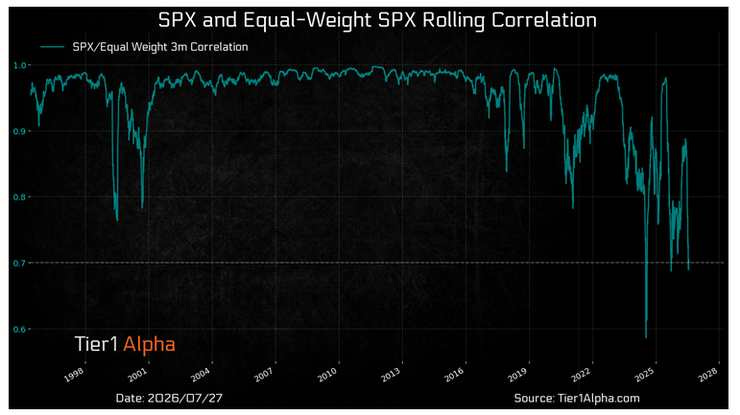
That is the concentration read in one line. The index is being priced by its top and the average constituent is doing something else, which is what breaks a rolling correlation this way. It is also why the broadening everyone waited for is not the healthy kind. A market broadens benignly when the correlation rises as laggards join the leaders. This one is falling because the leaders are leaving and the laggards are standing still.
THE BRIDGE
Behind the wall, the full build. The Fed decision tree with my probabilities set against the market’s, and why I am fading the 38 to 40 percent hike.
Full book, expressions and triggers at morningmusing.com.