
How You Like Them Apples?
morning musings 7.23.26

"Why can't apples taste like chocolate? I'd eat many more apples." ~Anonymous ( an old golf club friend to me last night!)
Somebody said that to me yesterday and I have been chuckling about it since. It is the most honest sentence about markets I have ever heard from a person who was not talking about markets. The wish is coherent. The wish is even reasonable. Apples really would be more popular if they tasted like chocolate.
None of which does anything whatsoever to the apple.
We are surrounded by apples this morning.
THE FIRST APPLE.
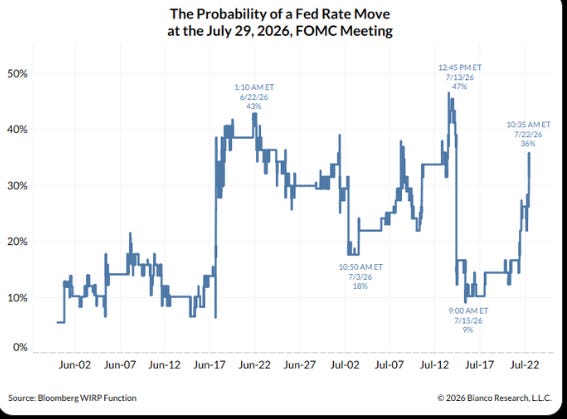
The President wants lower rates. He has been clear about it, repeatedly, at volume, for months. He also picked the current Chair. That Chair spent last week saying the Fed has ‘no tolerance’ for elevated inflation. Waller says another hot core print may require tightening. Cook is ‘prepared to act.’ Logan favors modestly higher rates. Hammack says inflation is her bigger worry. Williams has moved his main concern to AI-driven demand and says the Fed cannot look through it. Bianco’s read of WIRP put a move at next week’s meeting at 36% as of yesterday morning, against 9% on the fifteenth.
That is not a Fed being talked down. That is a Fed being talked past.
And in case the point needed underlining, there is now an external review of the 2023 SVB failure that some in the administration have privately discussed as a possible legal basis for removing Governor Michael Barr (BBG). Senator Warren calls the review politically motivated. Secretary Bessent pushed back. Set aside entirely who is right, because the market does not care and neither should we. Note only the mechanism: when the committee will not give you the rate, the remaining lever is the composition of the committee.
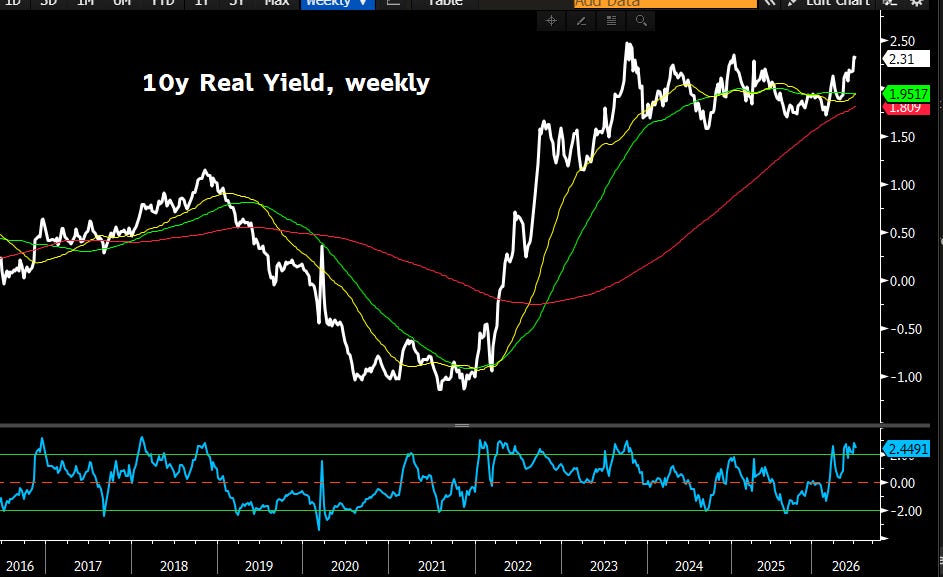
Markets do price that. They price it as term premium, and it is currently sitting at 2.31 on the ten-year real yield and 5.15 on the thirty. Wishing loudly at the Fed does not lower your borrowing cost. It raises it. Oh yay!
THE SECOND APPLE, and this one is ours. Every note on my desk this morning wants today to be a stagflation tape. Mine did too, right up until I checked. Brent through ninety-eight, war on a second chokepoint, the buffers gone, so: own energy, short duration, higher for longer, done by seven. It is a coherent wish. It is a reasonable wish. It is what I would want to be true if wanting were a strategy.
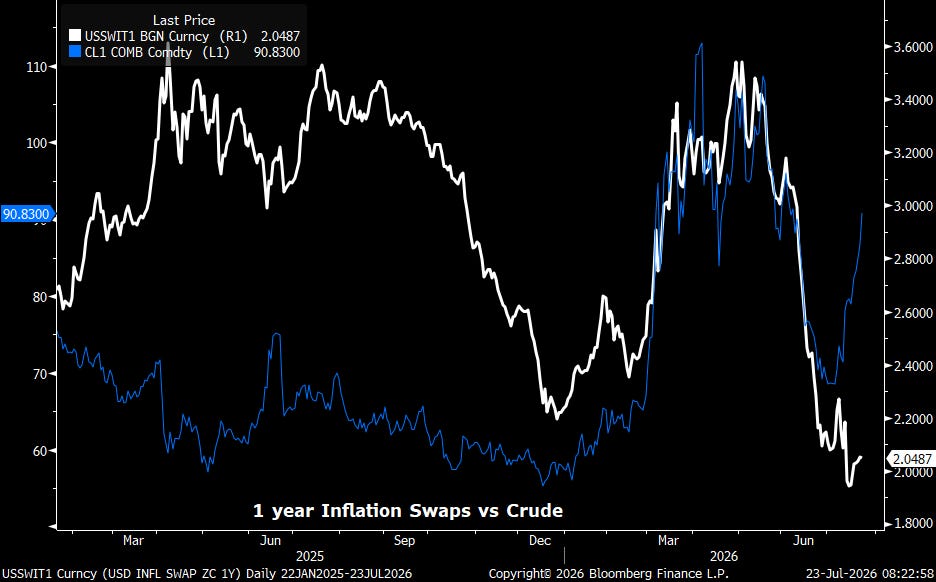
The one-year inflation swap has not moved.
TL;DR
Brent is up 4.8% to 98.61 and pinned within 43 cents of its session high on Houthi tanker strikes in the Red Sea, a second chokepoint behind Hormuz. Every desk note this morning says the same three words: cost-push stagflation.
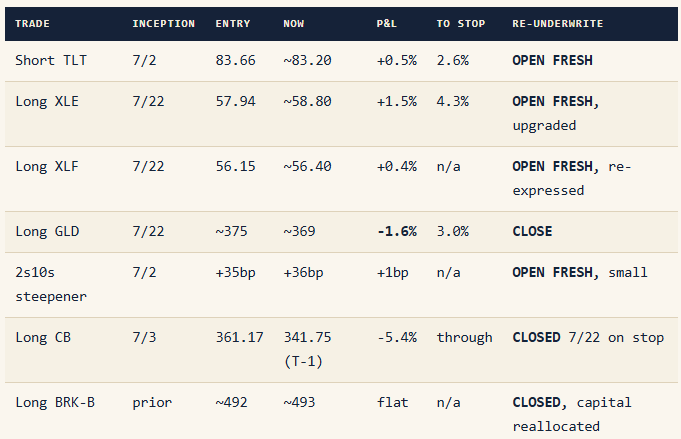
The one instrument built to price that says no. The 1yr USD inflation swap sits near 2.05%, roughly where it started July, while crude ran 63% off the trough. This is not an inflation-expectations shock. It is a real-rate shock, and the difference decides four of the five positions in the book. Gold gets cut. The duration short gets bigger. And the credit calm everyone is citing is an artifact of what has already left the index.
MY READ
I think the consensus has the right trade for the wrong reason, which is a more dangerous place to stand than being wrong outright.
The story everywhere this morning: oil shock, inflation returns, higher for longer, own energy and short duration. Fine as far as it goes. But run the mechanism. If this were a genuine inflation shock, breakevens widen, gold catches a bid, and the curve bear-steepens on the inflation leg. Check the tape. Breakevens flat. Gold down 1.56% to 4,087.30 on a war-escalation morning, trading thirteen dollars off its session low having opened at 4,126 (FMP). 2s10s at +36bp, nowhere near the +60bp that would signal an inflation term premium.
And run the haven table, because today it is unanimous. Gold offered hard. Bonds offered, 10Y at a fresh 2026 high. Yen offered, USD/JPY at 163.483, printing a new year high (FMP). Dollar bid. All four gone, on a morning when a second chokepoint closed.
What is actually moving is the real yield. 10Y real at 2.31, up through every moving average it has, at the top of its range since 2023. That single number explains the whole cross-asset picture, including the bit nobody can square. Gold does not fall on a war headline because investors stopped fearing war. It falls because the real discount rate on a zero-coupon perpetual just went up.
Note also what oil itself is doing, because it settles an argument. Brent at 98.61 with a session high of 99.04 is trading at roughly 96% of today’s range. Not up and fading. Pinned. The supply premium is being paid in full, which retires the ‘overbought, due a consolidation’ read that came in from the chartists this week (SMP).
So: the tape is a real-rate repricing wearing an oil shock’s clothing.
‘Higher for longer’ is the polite version. The impolite version is that if breakevens stay anchored while nominals climb, the Fed has no cover to look through any of it. Warsh has said ‘no tolerance.’ Waller says another hot core print means tightening. Cook is ‘prepared to act.’ Logan wants modestly higher rates. Williams has moved his main inflation worry to AI-driven demand. Bianco’s WIRP read has the 29 July meeting at 36% as of yesterday morning, up from 9% on 15 July.
The variant view, stated plainly: the pain trade is not $110 oil. It is a hike. Everyone is positioned for the shock. Almost nobody is positioned for the response.
Falsifier, one print: the 1yr swap through 2.50% while Brent holds above $95. That is the market capitulating to pass-through, at which point this is a stagflation tape after all, gold works, and I am wrong about the whole thing.
WHAT MATTERS TODAY
The second chokepoint. Houthis struck two Saudi tankers in the Red Sea overnight, the first commercial attacks in months, with the Encelia confirmed hit. That matters more than the barrel count because Bab el-Mandeb was the workaround. Gulf crude routing to the Red Sea was the release valve on Hormuz. Close it and there is no valve. Hormuz traffic is down to roughly ten vessels a day against 130-plus pre-conflict, war-risk insurance has gone from 1-3% of hull value to 7.5-10%, and DP World is now building two terminals at Fujairah on a 50-year concession, which tells you what the operators think the duration of this is (BBG).
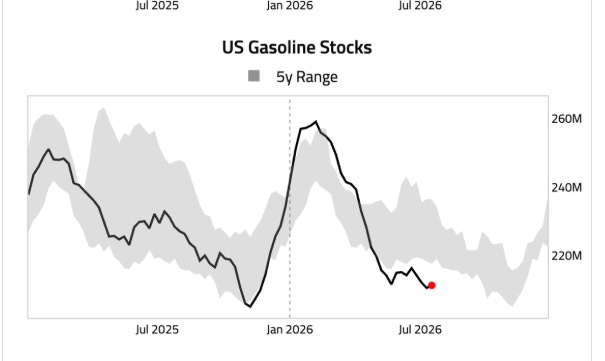
And there is nothing underneath it. Total US crude inventories including SPR are at their lowest since 1984. The SPR alone is back at 1983 levels. Commercial crude and gasoline are both below their 5-year ranges. DataTrek made the same point yesterday from the other direction: incremental domestic production makes the SPR level less alarming, but it strips the government of the ability to cap a price shock. The buffers that absorbed the first four months of this war are spent.
The capex bill got rejected, not the demand. GOOGL beat on revenue at $119.8B with cloud up 82% and a $514B backlog, then fell 3.5% because 2026 capex went to $195-205B and free cash flow turned negative. TSLA down over 5% on the same disease. Yet SK Hynix +6.5%, MediaTek +5.2%, KOSPI +4.4%, and ServiceNow up 7%. The market is not selling AI. It is selling the entities writing the cheques and buying the ones cashing them.
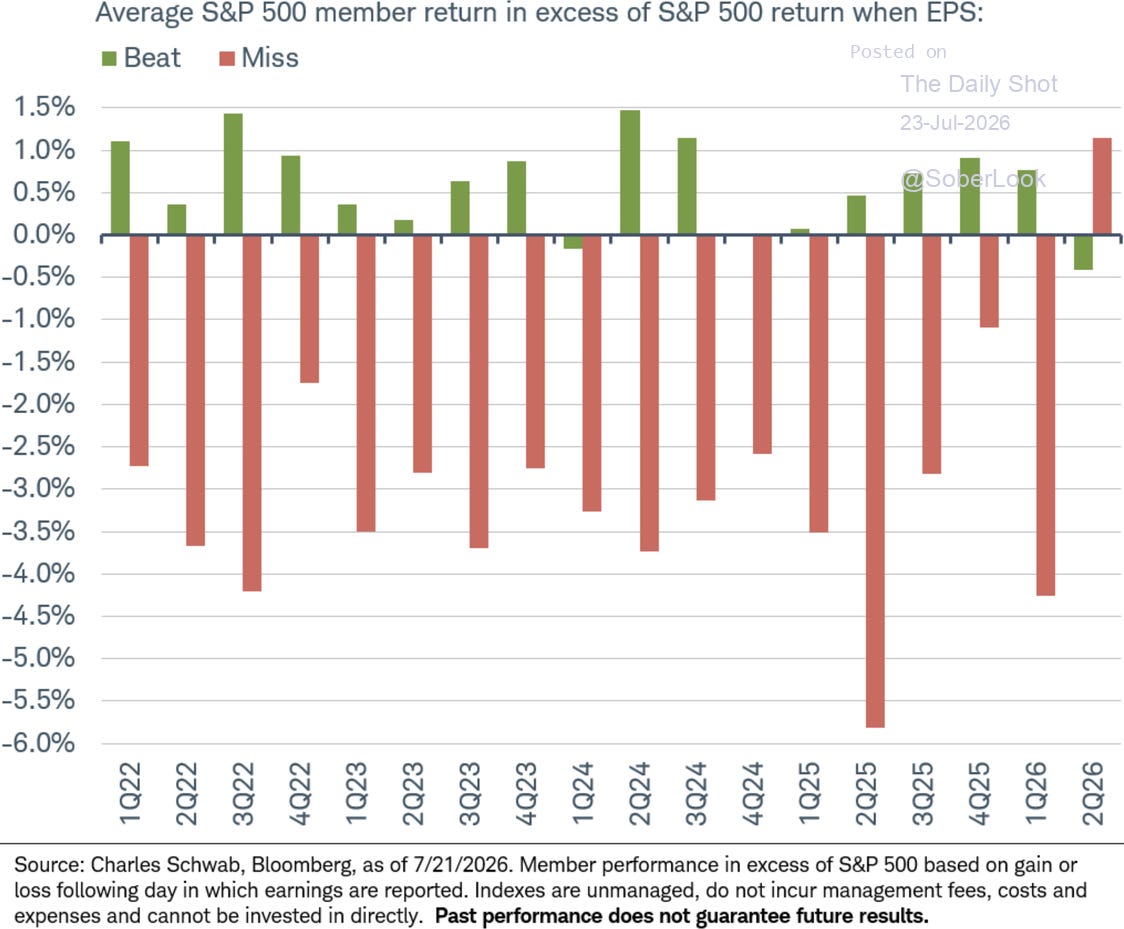
The earnings reaction function has inverted. This is the quiet anomaly of the week. Schwab’s data has 2Q26 as the first quarter in the series where EPS beats underperform the index (roughly -0.4% excess) while misses outperform (+1.1%). Every prior quarter since 1Q22 punished misses by 2.5 to 5.8%. When good news stops paying and bad news stops costing, positioning is doing the pricing, not fundamentals.
MOVERS THAT MATTER
Alphabet, -3.5%. Not the miss story, the ratio story. $205B of capex against negative FCF re-rates every hyperscaler on cash conversion rather than growth. So what: the pair trade is long the supply chain, short the balance sheet paying for it, and it is now confirmed by price rather than assumed.
First Citizens, EPS $57.09 against $40.44. Net charge-offs well below forecast. So what: this is the cleanest read available on regional credit quality going into today’s USB, CFG, CBSH and FNB prints, and it says the consumer-credit crack has not reached the bank balance sheet. That is a fact about banks, not a fact about credit. See below.
Blackstone, $68.3B of inflows against $53.9B expected, fee-related earnings $1.78B against $1.59B. So what: the alternatives complex is still gathering assets at pace while the listed private-capital stocks are down more than 15% year to date and PSP trades below all three of its moving averages. Flows and marks are pointing in opposite directions, and only one of them clears daily.
FINANCIALS
The interesting thing about financials this morning is a disagreement between price and positioning that should not exist.
XLF closed 7/22 at 56.065, roughly 91% of the way up its 52-week range of 47.67 to 56.94 (FMP, T-1). Deutsche Bank has financials group positioning at the 23rd percentile. Price near the top, positioning near the bottom. The standing sell-the-news flag we run whenever XLF is high in its range assumes the group is crowded.
The level that matters is 4.75 on the 10Y. We are at 4.673. Eight basis points. That is the AOCI threshold where AFS and HTM marks start biting the regional cohort, and it sits directly between today’s prints and Friday’s. USB, CFG, CBSH and FNB report today; TFC, FITB and RF Friday premarket. A group that is underowned, asset-sensitive and reporting into a catalyst is a good setup right up until the moment the mark on the securities book becomes the story.
Now the subsector split, because ‘financials’ is doing no work as a word here.
Deposit franchises are fine. Six of six mega-banks beat by wide margins, First Citizens beat by 41% with credit better than forecast, Bread Financial’s net loss rate came in at 6.98% against 7.14% expected. Nothing in the bank tape says stress.
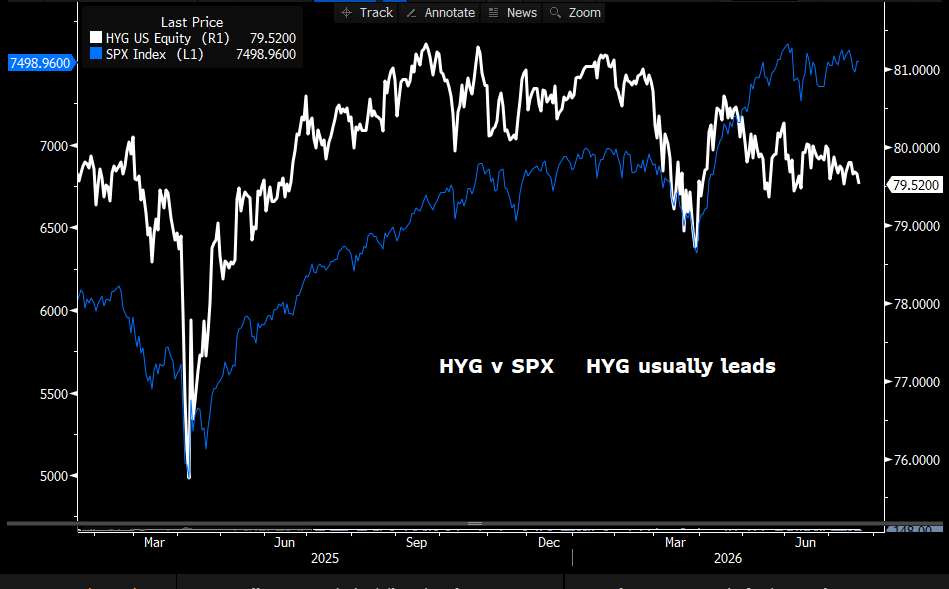
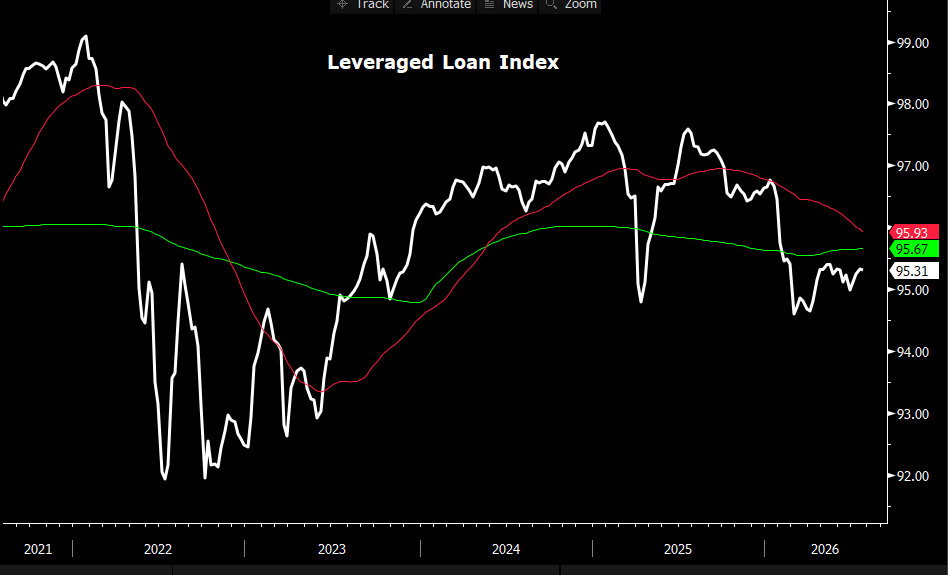
Everything that owns credit at a mark is not fine. The Leveraged Loan Index is at 95.31, below both its moving averages, making lower highs since early 2025. HYG is rolling over while SPX sits near its highs, and HYG normally leads. iTraxx Crossover just hit a six-week high at 260bp. PSP sits at 57.75 with its 50, 100 and 200 all above it.
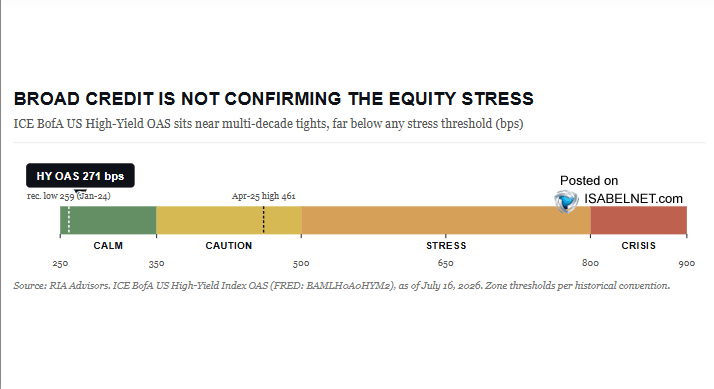
So how is HY OAS at 267bp? Because the index is not the market anymore. Five years of weak paper has migrated out of high yield into private credit, which does not print a daily spread. Reading HY OAS to assess corporate credit stress in 2026 is like reading the S&P to assess small caps. It tells you about the survivors. My friend PauloMacro has been making the migration argument since December and is now saying it is starting to tip. To me, an essential read.

Worth noting what this does to the recession models everyone quotes. Goldman has USD HY spread contributing 0% and Excess Bond Premium 3%. Those are not two independent all-clears alongside the OAS reading. They are the same input wearing three hats. Strip it out and the only indicator in that model with a pulse is 10y-2y at 30%.
The so-what: own the deposit franchise, avoid the balance sheet that marks to a spread. That is the trade, and it is intra-sector, which is where the edge is. Not ‘long financials.’
Carry forward: student loan defaults hit record highs post-pause (CBS), the tax refund tailwind as a share of income has gone to roughly zero as of July while gasoline spending peaks in August (TDS). That is a four-to-six week lead on card NCOs at SYF and COF, and it lands after these prints, not in them.
SECTORS
XLE Up hard. Brent ~$98.50, WTI $90.32, the only European sector green. The arm crossed and it is working.
XLF Firm into the regional prints. Underowned per DB, eight bp from the AOCI line.
XLK Bifurcated. GOOGL -3.5%, TXN -4% on a beat, NOW +7%. Not a sector, a referendum on who pays.
XLV Quiet outperformer. TMO +3.5%, DGX raised FY to $11.05-11.25. XLI The war trade. LMT +7.7%, RTX +4.3%, CSX +3.8% on a guidance raise. XLY XLY/SPY at 0.1526 and making new lows. The consumer ratio has not stopped going down since 2021.
XLP Nestle -7.3%, worst since 2020, on 1.5% real internal growth. Staples are not defensive when volumes are the problem.
XLU Underperforming into rising real yields, which is what bond proxies do.
XLB CLF +7%, Teck +5.1% on copper, Dow +2.7%. DB has materials positioning at the 0th percentile, which is the most asymmetric line in the whole positioning set.
XLRE The worst place to be with a 30Y at 5.16%. XLC GOOGL is the sector. See above.
FLOWS & POSITIONING
Three things that do not fit together, which is usually where the money is.
Demand is historic. Baird has cumulative equity ETF flows running at roughly twice the 2025 pace. US fund investors are on track to add $1T to long-term holdings this year per DataTrek, though only 14% of it has gone to domestic stocks, with bonds the preferred destination by a wide margin. Margin debt YoY has pushed back into the warning band on Topdown’s indicator and sits near 4.6% of nominal GDP on DB and FINRA data, matching the 2021 peak.
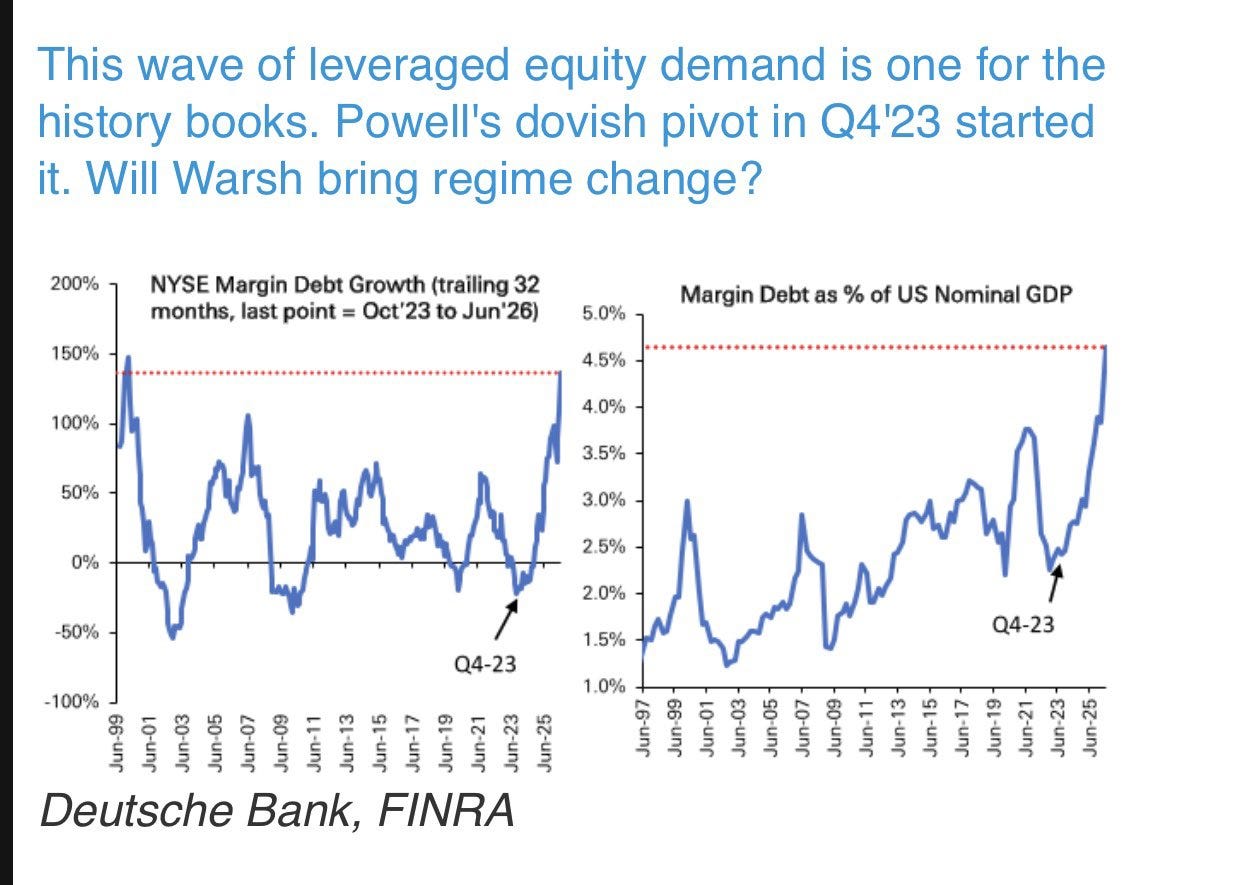
Supply of conviction is not. Short interest as a share of shares outstanding is near record on both the Russell 3000 and the S&P. Financials sit at the 23rd percentile of positioning and materials at the 0th. Leveraged demand at cycle highs, discretionary positioning at cycle lows.
And the factor is already broken. The GS momentum pair is in a roughly 32% max drawdown while SPX drawdown is near zero. Pasquariello has 1-month realized vol on the TMT momentum pair at 107, against a 12 low over the plotted period. SPX 1yr realized correlation is at 0.087, near the bottom of the fifteen-year range.
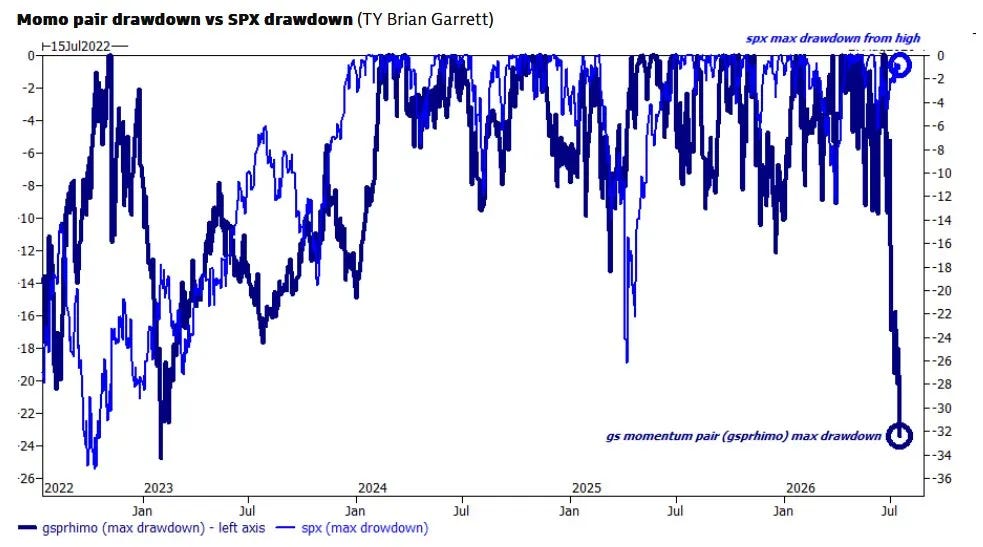
That combination, index calm and factor carnage, is not stability. It is the index absorbing an enormous amount of single-stock dispersion.
BofA has the single-stock-minus-index implied vol spread at its highest since the dotcom period, and their own annotation points at further widening.
Meanwhile, VIX is 18.21, up 9.4% and sitting near its session high, while SPX is down 0.14% (FMP). Vol bid that hard with no equity damage underneath it is hedging demand, not liquidation. Goldman’s Vol Panic measure has run from roughly 1.5 to 6.8 in a fortnight.
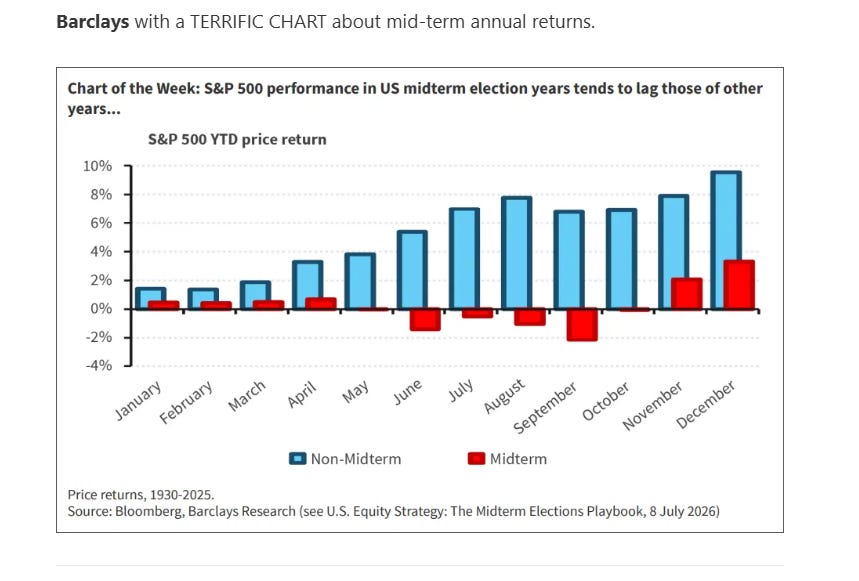
Two seasonal notes, neither a thesis. Late July is the 20-year trough for SPX volatility, and the path runs up through October. And per Kevin Muir’s Barclays chart, midterm years lag badly from June through September before a November-December recovery.
One caution on the crowd’s favorite bullish chart. BofA’s semis exhibit shows the fastest recovery from a 15%-plus SOX drawdown in thirty years. The second-fastest was November 1999.
Behind the wall:
The full book marked to today, including the one position I am closing and why the red team was right about it.
Six expressions with entry, stop, target, R:R and the falsifying print, including a regionals-versus-listed-private-capital pair that isolates the deposit franchise from the mark, and a financials trade I am explicitly standing down on with the level that turns it on.
The 29 July FOMC decision tree branched three ways off a single number.
Conviction ranking.
And the four levels on the watchlist that change the regime call rather than just the P&L.
Plus two subsector deep dives that do not fit up here. Consumer discretionary, where XLY/SPY just made new lows at 0.1526 and has not stopped falling since 2021, against a July in which the tax refund tailwind went to zero and gasoline’s share of income peaks in August. And consumer staples, where Nestle just had its worst day since 2020 on 1.5% real internal growth, which is the number that tells you pricing power has run out. Two sectors, one wallet, opposite ends of the same squeeze.
morningmusing.com
Disclaimer: Opinions are mine alone and may change. It does not constitute an offer to buy or sell or a solicitation of an offer to buy or sell any security, loan or asset or to participate in any trading strategy. It is not intended to form the basis of any investment decision, should not be considered a recommendation, and does not constitute an offer or solicitation with respect to the purchase or sale of any investment, nor is it a confirmation of such terms.
Keep reading with a 7-day free trial
Subscribe to Morning Musings- Thoughts from Dauber Island to keep reading this post and get 7 days of free access to the full post archives.